
The Authorization Rate Battle
How the most overlooked metric in payments became the competitive fault line between issuers, acquirers, networks, and the processors who decided to do something about it

A customer reaches checkout. Card declined. They try again. Declined again. They close the tab.
No fraud occurred. A real customer, a valid card, available funds. Gone. The merchant absorbed the loss. The issuer gave up the interchange. Every party in the chain paid a price, and not one of them is accountable for it.
I have watched this happen, at scale, across dozens of markets, for more than a decade. And the part that never stops being remarkable is this: the industry built an entire discipline around the fraud it loses to. It built almost nothing around the revenue it throws away itself.
That’s changing. This series is about how, and what it means for every institution that still hasn’t decided which side of that change it’s on.
Let’s dive in.
A Decision Made in the Dark
Every card payment triggers a relay race across five parties in under two seconds.
The customer initiates.
The gateway validates.
The acquirer formats and forwards.
The card network applies its intelligence layer.
The issuer makes the final call.
Then the whole thing runs back in reverse, ending in an approval or a two-digit code that means no.
That relay sounds clean. It isn’t.
The merchant at the start of the chain holds the richest signal imaginable: device fingerprint, session behaviour, IP address, browsing history, account age, purchase context. By the time that signal reaches the issuer, much of it has been stripped, garbled, or compressed beyond recognition. Free-form merchant descriptions get truncated. MCC codes collapse entire business categories into four-digit shorthand. “Yum Brands” tells you nothing about whether this is a $6 KFC order or a $400 catering invoice.
Here is what that signal loss actually looks like in practice.
An issuer’s model sees a transaction from an unfamiliar merchant descriptor, a card used in a different geography than usual, at an amount slightly above average. Three soft risk signals, none of them individually decisive. But together, with no behavioral context to offset them, the model declines. The customer is on a business trip. The merchant is a hotel. The card is perfectly valid. Nobody ever finds out what happened.
Checkout.com and Oxford Economics, in their September 2023 research across 1,500 enterprise businesses, found that 50% of merchants don’t receive raw response codes when a payment fails. 67% don’t receive fraud or chargeback analysis from their PSPs at all. The chain is opaque by design and by accident, and by decades of accumulated technical debt that nobody has been paid to fix.
The issuer, making the most consequential decision in the transaction, is working with the least context about what’s actually happening. And when the answer is no, the message sent back is usually “Do Not Honor.” Three words. No explanation. No feedback loop. No accountability.
How the Incentives Built the Problem
This isn’t a story about incompetence. The over-decline problem is the entirely predictable output of a deeply irrational incentive structure, and I want to be precise about why, because most analysis of this topic stops at the surface.
Every $1 of fraud costs US financial services firms $4.41 in total, per the LexisNexis True Cost of Fraud Study published in April 2024. Each disputed transaction costs issuers between $9.08 and $10.32 to process (Mastercard, 2025). Bank regulatory penalties surged 522% in 2024, according to Alloy’s 2025 State of Fraud report. The compliance and reputational consequences of approving fraud are serious, visible, and directly attributable to the team that made the decision.

False declines? There are no regulatory penalties. No network monitoring programmes. No standardised reporting requirements. The cost lands entirely on the merchant’s income statement, not the issuer’s balance sheet.
When I’ve sat with issuer risk teams and walked them through this arithmetic, the response is usually a version of the same thing: “We know.” They know. The incentive structure isn’t invisible to the people inside it. It’s that the institutional gravity of accountability for fraud is so much stronger than the diffuse, unmeasured cost of a declined legitimate transaction that the rational individual response, inside that institution, is to optimise for what they’re measured on.
27% of all declines originate from issuers. The most common decline code across the industry is “Do Not Honor,” a catch-all that tells nobody anything and exists precisely because specificity creates accountability.
The system didn’t break. It worked exactly as designed. That’s the problem.
The Spiral That Nobody Measured
The problem doesn’t stay static. It compounds, and it does so in a way that’s genuinely difficult to detect unless you’re looking at the right data.
Ethoca, a Mastercard subsidiary, documented the mechanism. Chargebacks, including friendly fraud, get coded as fraud in issuer training data. Models become more conservative. More legitimate transactions get declined. Frustrated customers stop using the card. The ratio of fraudulent to legitimate transactions in the training data shifts further toward fraud. Models tighten further.
I’ve seen this play out from the inside. A spike in chargebacks from a specific merchant category triggers a blanket tightening. The surgical response, identifying the actual fraud vector and targeting it precisely, requires data infrastructure and analytical investment that many institutions don’t have. The blunt response, tighten the rules across the board, is fast and defensible. It’s also quietly devastating for everyone operating in that category who wasn’t part of the fraud problem at all.
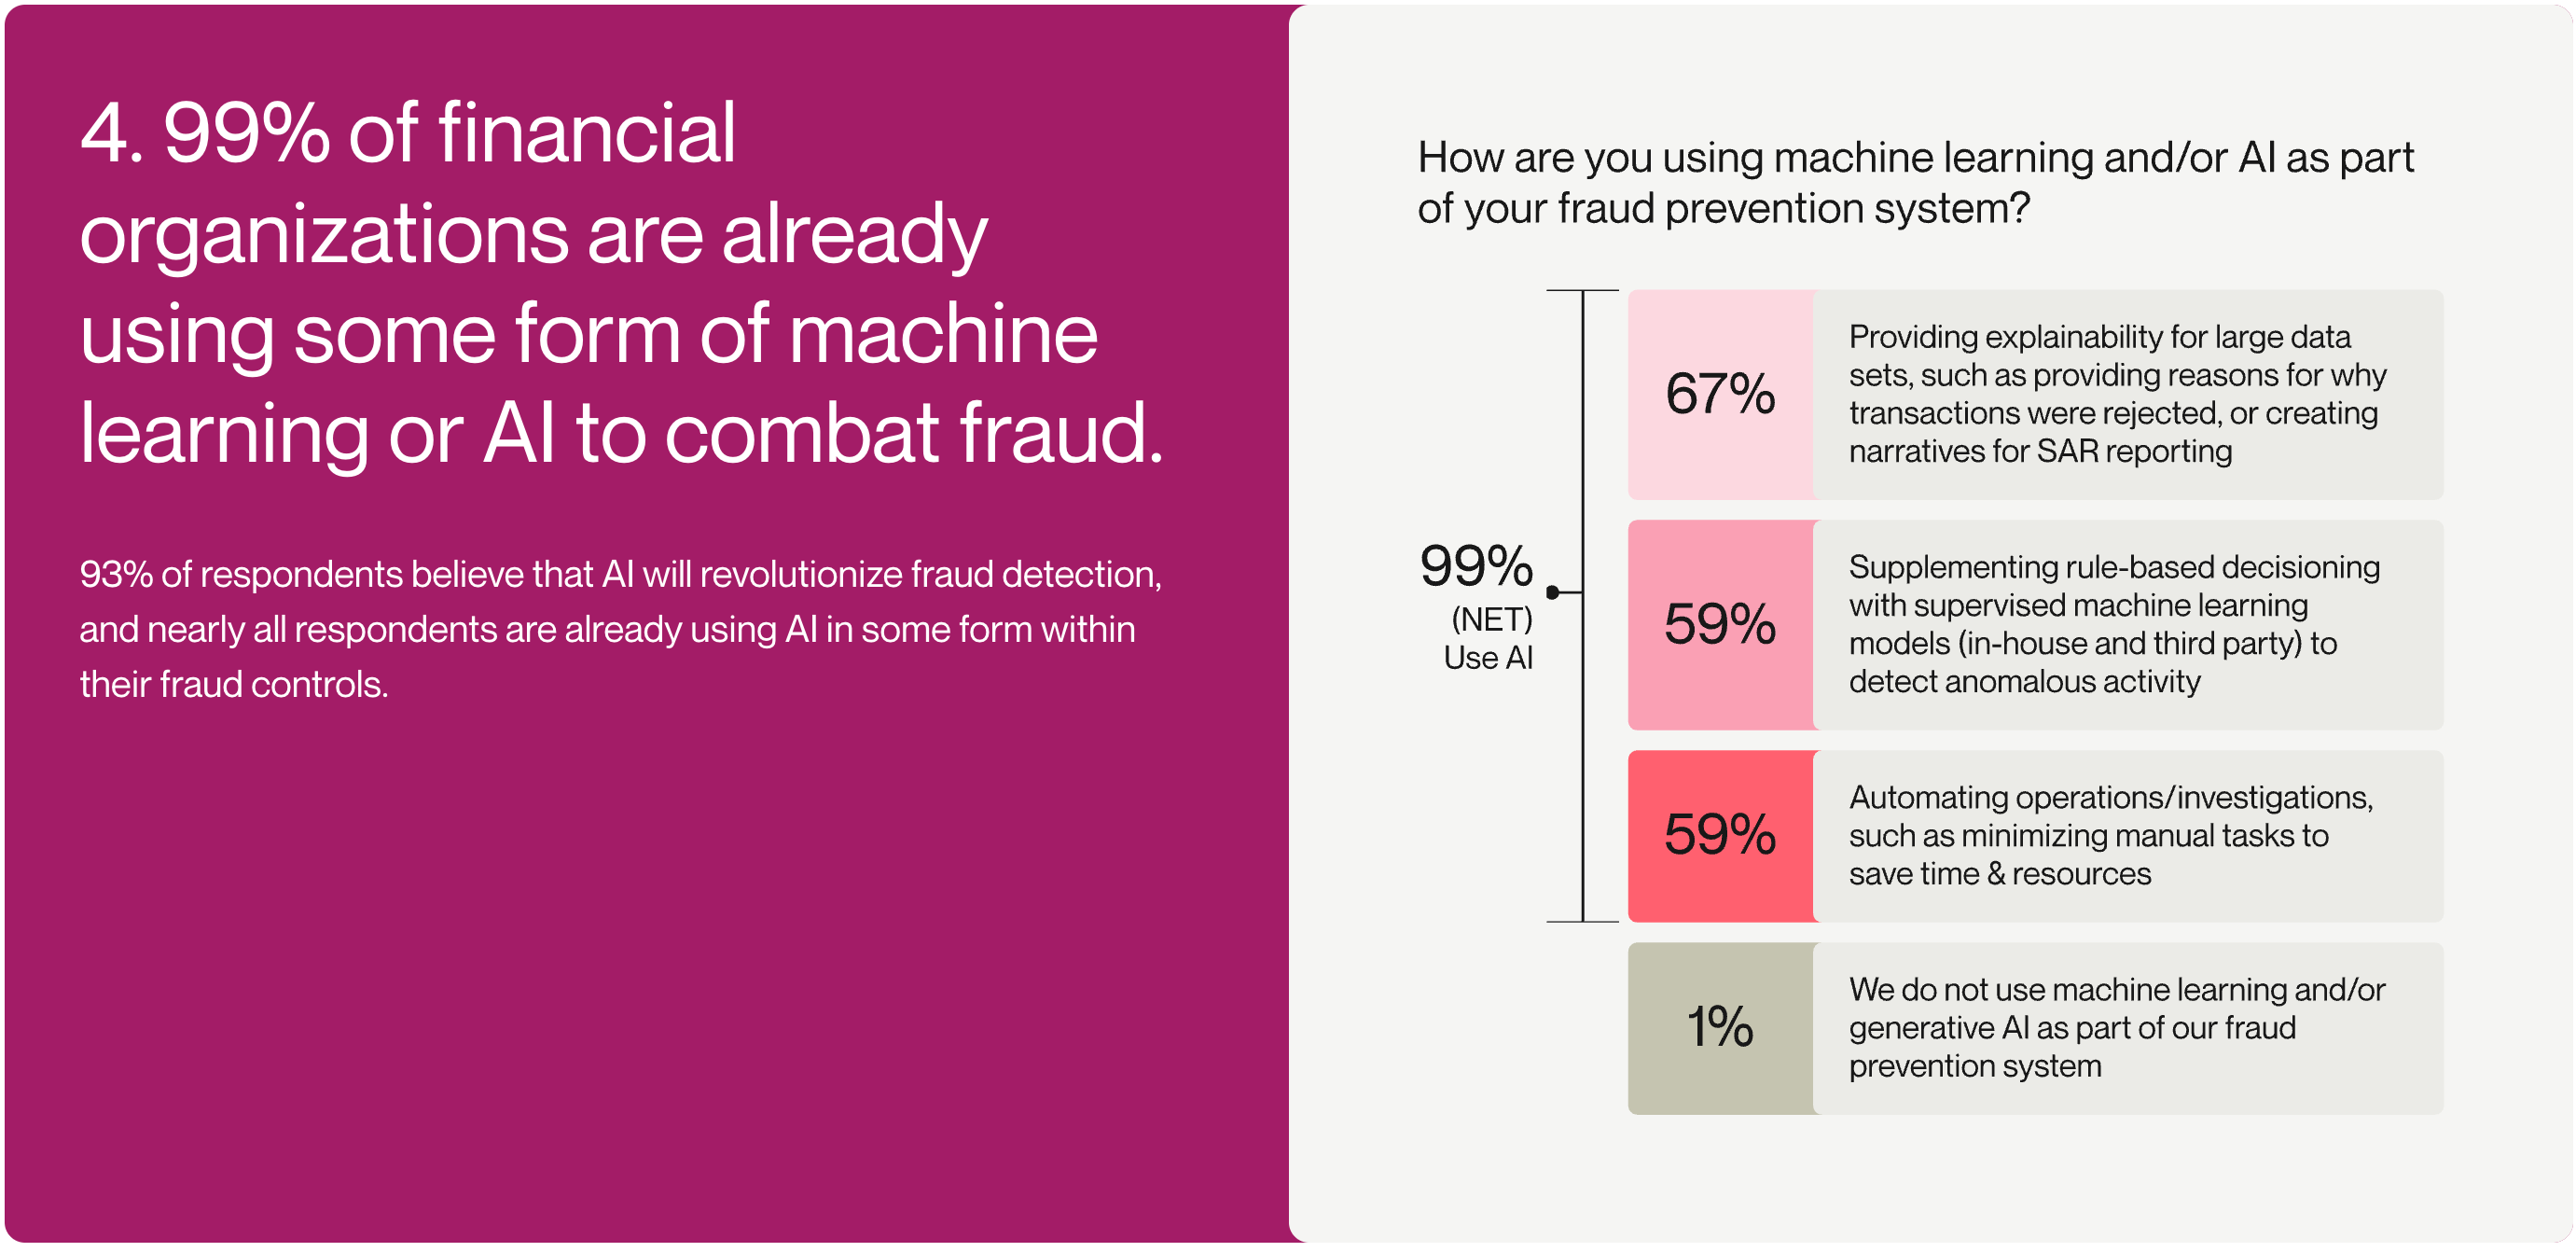
Alloy’s 2025 State of Fraud report found that 99% of financial institutions now use ML as part of their fraud prevention. That headline sounds like progress. It isn’t the whole story. “Using ML” describes a spectrum that runs from full neural network-driven authorization to a static rule set with an ML layer that the rules can override whenever a risk manager feels uncomfortable.
Academic research published in JISEM in 2024 confirmed what practitioners have known for years: traditional rule-based systems “rely on static if-then rules and manual reviews” and are “often ineffective against today’s evolving fraud patterns, leading to high false-positive rates.” The sophistication gap between institutions is enormous. It just doesn’t show up in the metric that gets reported.
ClearSale’s 2020 research found that 62% of e-commerce merchants experienced higher false decline rates over a two-year period, attributed partly to increasingly automated fraud filters. That study is five years old now, and no equivalent independent research from the past two years exists in public sources. But the structural forces driving that trend, more automation, more conservative overlays, more post-breach tightening, haven’t reversed. They’ve accelerated. This is inference, not current data, and I want to be honest about that distinction.
The false positive spiral is insidious because it feels like the system is working. Fraud losses down. Chargeback ratios clean. Regulatory posture solid. The merchant churning quietly in the background is someone else’s problem.
What This Actually Costs
Numbers in this space need careful handling. Let me work through what we actually know, and be clear about what’s solid and what isn’t.
The most cited figure in any false decline conversation is $443 billion.
It comes from an Aite Group report published in April 2020, commissioned by ClearSale, a fraud prevention vendor. It represents the gross value of legitimate card-not-present transactions falsely declined globally. Not net merchant losses. Gross transaction value. The most recent update from Datos Insights, the firm that absorbed Aite Group, was 2021. Global e-commerce has grown by roughly 70% since then. Meaning that the current figure is almost certainly substantially higher.
A more methodologically grounded figure comes from Checkout.com and Oxford Economics. Their September 2023 research measured $50.7 billion in direct merchant false decline losses across the US, UK, France, and Germany, four markets only. That represented a 140% increase from their own 2020 estimate of $20.3 billion for the same four markets.
Compare either number to global card fraud losses: $33.41 billion in 2024, per the Nilson Report published in January 2026. The math is uncomfortable. On the most conservative methodology, using four markets only, false declines are still doing more measurable damage than the fraud the industry built its entire defensive architecture to prevent.
The unit economics bring it home.
Worldpay’s 2025 analysis states that for a merchant processing €1 billion annually, a single percentage point improvement in authorization rate recovers €10 million in revenue, at zero incremental customer acquisition cost. That’s not a projection. That’s revenue being earned by customers who chose to pay, being turned away, and not returning.
Authorization rates vary by as much as 8-10 percentage points across regions for the same card type, depending on acquirer relationships, this from acquirer and PSP research and vendor-reported. Cross-border transactions carry a 5-13 percentage point authorization penalty versus domestic. And only 64% of merchants currently track their false decline rates at all, per Aite-Novarica data cited by Signifyd.
The industry is losing money it hasn’t even bothered to measure.
When the Networks Started Paying Attention
The networks saw the problem first, because they’re the only parties in the chain with enough volume to see the patterns that individual institutions can’t.
Visa now processes 257.5 billion transactions annually (FY2025 10-K). Mastercard processes 159.4 billion. At that scale, the signal that’s invisible to any individual issuer becomes statistically obvious. The result was a shift in what network intelligence is actually for.
Visa’s Advanced Authorization evaluates 500+ risk attributes per transaction in under a millisecond on-network. Mastercard’s Decision Intelligence generates predictive risk scores using behavioural signals, geo-data, spending patterns, and device information. These products are positioned as fraud tools. Their primary practical function is authorization intelligence. The distinction matters because it changes how institutions should be thinking about them strategically.
Mastercard’s Decision Intelligence Pro, updated with generative AI capabilities in February 2024, claims an 85% reduction in false declines. That figure is vendor self-assessed with no independent verification. Apply appropriate scepticism. However, even a fraction of that performance differential, applied at the scale of a major issuer, is worth serious strategic attention.

Network tokenization proved the broader point in hard data.
Visa reports a 4.6 percentage point authorization rate improvement for tokenized versus PAN-based card-not-present transactions, based on FY22 VisaNet data. Their 2025 reporting suggests this has grown to approximately 6% for eligible merchants. The credential infrastructure shift wasn’t just a security upgrade. It was a signal quality upgrade. Better credentials produce better decisions. This is a pattern that runs through the entire authorization optimization story.
The Processors Who Built Their Own Answer
Here’s what gets lost when this conversation focuses only on network-level tools: the most compelling recent evidence that authorization optimization is both solvable and commercially decisive doesn’t come from Visa or Mastercard. It comes from the processors who decided not to wait.
Stripe processed $1.4 trillion in total payment volume in 2024, up 38% year-over-year, company-disclosed. That scale allowed them to build what they call the Payments Foundation Model: self-supervised learning across billions of transactions covering millions of businesses.
The results are specific and verifiable.
Hertz increased authorization rates by 4% when it moved its payments to Stripe. Smart Retries, which uses ML to identify optimal retry timing for failed recurring charges, reduces declines for subscription payments by up to 30%. Adaptive Acceptance tailors authorization requests to individual issuer preferences, improving first-attempt success rates before any retry is needed. Stripe’s founders, in their February 2025 annual letter, put it plainly: “We’re continually retraining dozens of machine learning models that optimize every part of the transaction flow over an economy-scale dataset. Businesses simply start making more money when they switch to Stripe.”
Adyen’s architecture is structurally different, and the H2 2025 results, reported in February 2026, make the logic clear. Uplift, now in general availability after a pilot with 60 enterprise merchants, is built on Dynamic Identification: AI applied to trillions of platform interactions to recognize patterns no individual merchant or issuer can see alone. The Personalize product within Uplift delivered up to 6% conversion improvement and up to 3% lower transaction costs in pilot results. At their November 2025 Investor Day, Adyen disclosed that Uplift had reduced false positives from 95% to 42%, with conversion uplifts of 1.07% to 2.76% for major merchants including Just Eat Takeaway and American Eagle. Nord Security recorded a 10% increase in successful customer-initiated transactions. During Black Friday and Cyber Monday 2025, Adyen processed 837 million transactions at 99.9999% uptime and recognized nearly 95% of approximately 400 million unique shoppers in real time.
That recognition capability is the architectural point. Adyen has built a graph that links transaction attributes across its entire platform. When a shopper arrives at a new merchant, Adyen already knows who they are. A high-value transaction in an unfamiliar geography isn’t a risk signal. It’s a known pattern for that specific customer. The decline that a static rule set would have issued becomes an approval. The revenue that would have been lost is recovered.
Approximately two-thirds of new Adyen merchants are now turning on parts of Uplift from day one.
What Stripe and Adyen demonstrate isn’t that you need their specific scale to solve this problem. What they demonstrate is that authorization optimization, built deliberately, using the data you have, on top of the network signals available to you, produces measurable commercial outcomes. They didn’t wait for the networks to solve it on their behalf. They treated authorization rate as a product problem and invested accordingly.
That is the proof of concept. The question for every acquirer, PSP, and issuer reading this is what they’re building with the same signals that are already available to them.
A Widening Gap, and a Closing Window
The industry is splitting into two groups.
Institutions that have treated authorization intelligence as a strategic capability, and institutions that are still treating it as an operational footnote. The distance between them, measured in basis points, is now large enough to show up in revenue and in competitive position.
European banks got a preview of what that pressure feels like when it arrives all at once. CMSPI’s independent analysis of the PSD2 SCA enforcement period found a weighted average 30% failure rate on 3DS2-challenged transactions, with potential annual merchant losses of €86 billion across Europe. The adaptation was bifurcated. Tier-1 merchants with sophisticated PSP partners achieved 98% exemption request honour rates. Smaller merchants and issuers in Southern and Eastern Europe were still recovering years later.
SCA was a compliance event that became an authorization stress test. The institutions that understood it as an optimization problem adapted. Those that treated it as a compliance checkbox are still paying for that choice.
The window to catch up is not closing immediately. But it is narrowing, and the data moat concern that many institutions cite as a reason not to start is mostly a distraction.
The network scoring signals, VAA, Decision Intelligence, and the tokenization infrastructure, are available to any institution willing to integrate them properly. 3DS 2.x, which supports over 150 data elements in the authentication request, is an authorization optimization tool that most institutions are deploying as a compliance requirement. Retry logic informed by actual issuer response patterns is achievable without a trillion dollars in processing volume.
The gap for most players isn’t access to the tools. It’s the absence of a strategy to use them. And that is a choice, not a constraint.
What This Series Is About
The authorization decision is being contested on four distinct fronts. Each has its own players, incentive structures, and recoverable value.
Issuers hold the final decision and face the sharpest structural distortions. The tools to correct the incentive imbalance exist. Using them requires acknowledging the problem first, which is harder than it sounds.
Acquirers are sitting on authorization rate points they haven’t claimed. The mechanics of recovery are more accessible than most organizations have been willing to invest in finding out.
The networks are building AI infrastructure at a scale that creates compounding data advantages. Understanding what those models actually evaluate, and what gets lost in the handoffs between them, is now a strategic literacy requirement.
And then there’s what comes after all of that. AI agents transacting autonomously produce no mouse movements, no session histories, no device fingerprints in any conventional sense. The entire behavioral signal infrastructure that current authorization systems depend on doesn’t exist for machine-initiated transactions. Visa launched its Trusted Agent Protocol in October 2025. Mastercard unveiled Agent Pay in April 2025. The industry is already trying to solve a problem it hasn’t yet fully priced into its current infrastructure decisions.
Over the next four issues, we go deep on each of these fronts. With the mechanics, the data, and the strategic implications for anyone working in acquiring, issuing, or as a PSP.
I’ve spent a long time working on this problem. From the inside of the systems that process these decisions, across the institutions that build them, across markets where the gap between the best and the rest is measured in hundreds of millions of euros.
The authorization rate has always been the most important number in payments that nobody was treating as important.
That’s finally starting to change. The question is whether your institution is part of the change, or part of the problem it’s correcting.
Thank you for reading.
P.S. If you are looking for a Payments Strategist/Data Scientist to help you figure out how to start leveraging data as an asset or like to educate your organization or audience through an event or webinar based on 20+ years of experience, don’t hesitate to email or DM me to set up a call and discuss how I can help.
Or if you appreciate my work, feel free to buy me a coffee!